
Finding the ‘k’ in K-Means Clustering
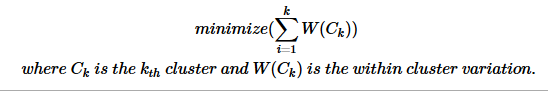
Determining the ideal number of cluster in a given data-set is one of the key task in data clustering. Typically, people may prefer to go by hunch based numbers assigned to clusters. Given a value to ‘k’ K-Means will produce ‘k’ number of clusters, such that the total intra-cluster variation (total within-cluster variation/total within-cluster sum of square) is minimized.
 </img>
So how will be find the optimal ‘k’. Many approaches are proposed to solve this issue. Some of the most used methods incudes Elbow Method, Akaike information criterion (AIC), Bayesian information criterion (BIC), Deviance information criterion (DIC), and Silhouette. In this post I am going to give a quick walk-through of Elbow Method.
1) Compute clustering algorithm (e.g., k-means clustering) for different values of k. For instance, by varying k from 1 to 10 clusters
2) For each k, calculate the total within-cluster sum of square (wss)
3) Plot the curve of wss according to the number of clusters k.
4) The location of a bend (knee) in the plot is generally considered as an indicator of the appropriate number of clusters.
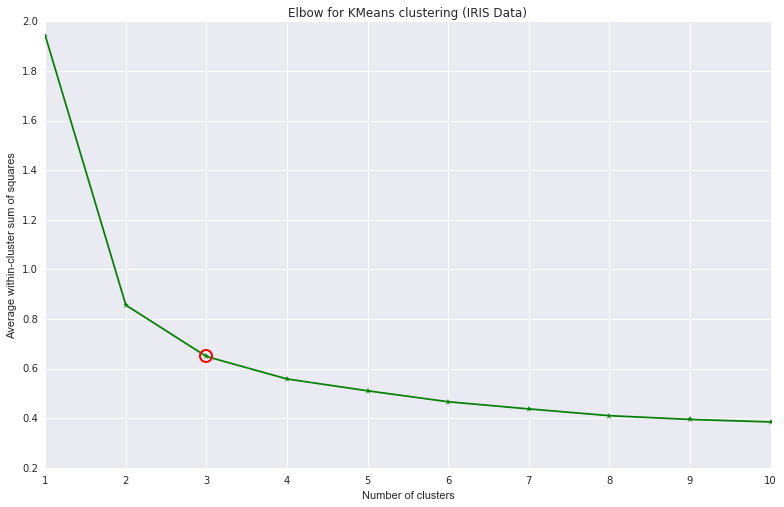
I have made a simple experiment with the IRIS data with elbow. I have used sklearn,scipy, numpy and pylab for the exercise. The plot generated from the same is shown below.
 </img>
The code :
Remember that Elbow is a heuristic method. It may produce a single elbow, more than on elbow or no elbow too L. So it may or may not work in the case of your data. In such scenarios we may have to use alternative methods.
Happy Data Science Hacking !!!